

The St. Louis Gateway Arch
During the spring break trip to St. Louis, Missouri, I
paid a visit to the St. Louis
Gateway Arch. On the guided tour, I learned that the arch is 630 feet tall and
the legs of
the arch are 630 ft. apart. Being on spring break but still thinking about math,
I look at
the arch and immediately see a parabola. In a fervent effort to analyze this
amazing
curve, I realize that if I only knew three points, then I could determine the
equation of the
parabola.
1. Based on the information I learned in the tour, is it
possible come up with three
coordinates? If so, what might they be? Are these the only possible coordinates?
2. Suppose you orient a coordinate grid with the bottom of
one leg of the arch at the
origin and the rest of the arch lying in the first quadrant so that the other
leg is
also on the x-axis. Sketch the arch in the first quadrant below and label as
many
coordinates as you can on the arch.
3. Using the general form of a quadratic function, y = a ×
x2 + b × x + c and the three
coordinates labeled above, write a system of three equations to solve for the
three
unknowns, a,b and c.
HINT: You will get c directly from one of the equations. Substitute this
value
into the other two. Use one of the other equations to find an equation for b in
terms of a, and substitute this value for b into the last equation and solve for
a.
You now have numerical values for a and c use these to solve for b.
4. Using the values for a,b and c from question 3 write the quadratic
equation for the
Gateway Arch and sketch it.
5. Is there another way to orient the coordinate axes that might make finding
the
quadratic equation easier? Choose another orientation and find the quadratic
equations using the new coordinate system. How are the two quadratic equations
related?
6. The formula actually used in constructing the St. Louis Arch is displayed
on the
inside of the arch. It is the formula for a catenary curve, which is the
shape a
free hanging chain takes when held at both ends. Mathematically, the function
that models such a curve is hyberbolic cosine. The formula used for the St.
Louis
Arch is y = 68.8× cosh(.01× x -1) . Use your graphing calculator to graph this
function. (If you have trouble find the cosh function, use the catalog feature
of
your calculator.) Is this graph close to the graph of either of the quadratic
functions you found? Can you transform either of the functions (the quadratic or
the hyberbolic cosine) in a way that preserves size (using only reflections and
translations) to show that they model close to the same physical structure?
Solutions
1. Based on the information I learned in the tour, is it possible come up
with three
coordinates? If so, what might they be? Are these the only possible coordinates?
The students can orient the coordinate system in many different ways and
get different sets of coordinates. Example:
(0, 0), (315, 630) and (630, 0) or
(-315, 0), (0, 630) and (315, 630)
2. Suppose you orient a coordinate grid with the bottom of one leg of the
arch at the
origin and the rest of the arch lying in the first quadrant so that the other
leg is
also on the x-axis. Sketch the arch in the first quadrant below and label as
many
coordinates as you can on the arch.
3. Using the general form of a quadratic function, y = a ×
x2 + b × x + c
and the three
coordinates labeled above, write a system of three equations to solve for the
three
unknowns, a,b and c.
HINT: You will get c directly from one of the equations. Substitute this
value
into the other two. Use one of the other equations to find an equation for b in
terms of a, and substitute this value for b into the last equation and solve for
a.
You now have numerical values for a and c use these to solve for b.
This creates an easy solution:
Eqn 1: c = 0
Eqn 2: 3152 × a + 315×b + c = 630
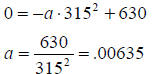
Eqn 3: 6302 × a + 630 ×b + c = 0
Substitute c into Eqn 2 and 3,
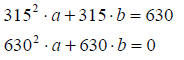
From 2 write b in terms of a,
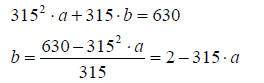
Substitute in 3 and solve for a
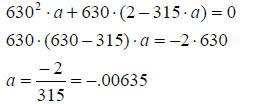
Solve for b
Answer:
a = -.00635
b = 4
c = 0
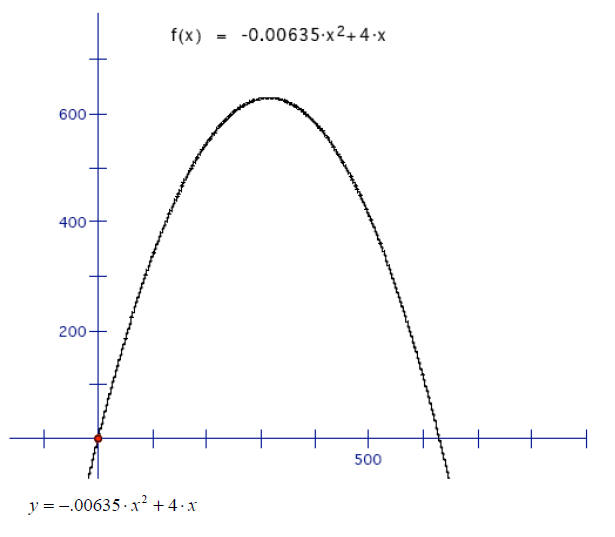
4. Using the values for a,b and c from question 3 write
the quadratic equation for the
Gateway Arch and sketch it.
5. Is there another way to orient the coordinate axes that
might make finding the
quadratic equation easier? Choose another orientation and find the quadratic
equations using the new coordinate system. How are the two quadratic equations
related?
One possibility is to center the legs around the y-axis
and get the following
three coordinates, (-315, 0), (0, 630) and (315, 0). By using knowledge about
transformation of the parent function y=x2 we get the following solution:
Plug in any value for y and x gives,
Leads to,
The two equations differ only in translation.
6. The formula actually used in constructing the St. Louis
Arch is displayed on the
inside of the arch. It is the formula for a catenary curve, which is the
shape a
free hanging chain takes when held at both ends. Mathematically, the function
that models such a curve is hyberbolic cosine. The formula used for the St.
Louis
Arch is y = 68.8× cosh(.01× x -1) . Use your graphing calculator to graph this
function. (If you have trouble find the cosh function, use the catalog feature
of
your calculator.) Is this graph close to the graph of either of the quadratic
functions you found? Can you transform either of the functions (the quadratic or
the hyberbolic cosine) in a way that preserves size (using only reflections and
translations) to show that they model close to the same physical structure?
The catenary curve described by the formula is a
reflection and a translation
of the curve modeled with the quadratic. In order to see this, it can be
manipulated by the parameters that will not change the size of our arch. The
catenary curve can be transformed to y = -68.8× cosh× (.01× x - 3.15) + 700 .
This graph and the first quadratic model created are very close together.
Some discrepancies occur because of where the tour guide’s measurements
are taken. We are told that the legs are 630 feet apart. This measurement is
taken from the outside edge of both legs. A graphic of the actual arch with
the published catenary curve overlaid shows the catenary curve does not
follow the outer edge of the arch, but instead represents an internal
structure.
Still, the two curves are very close.